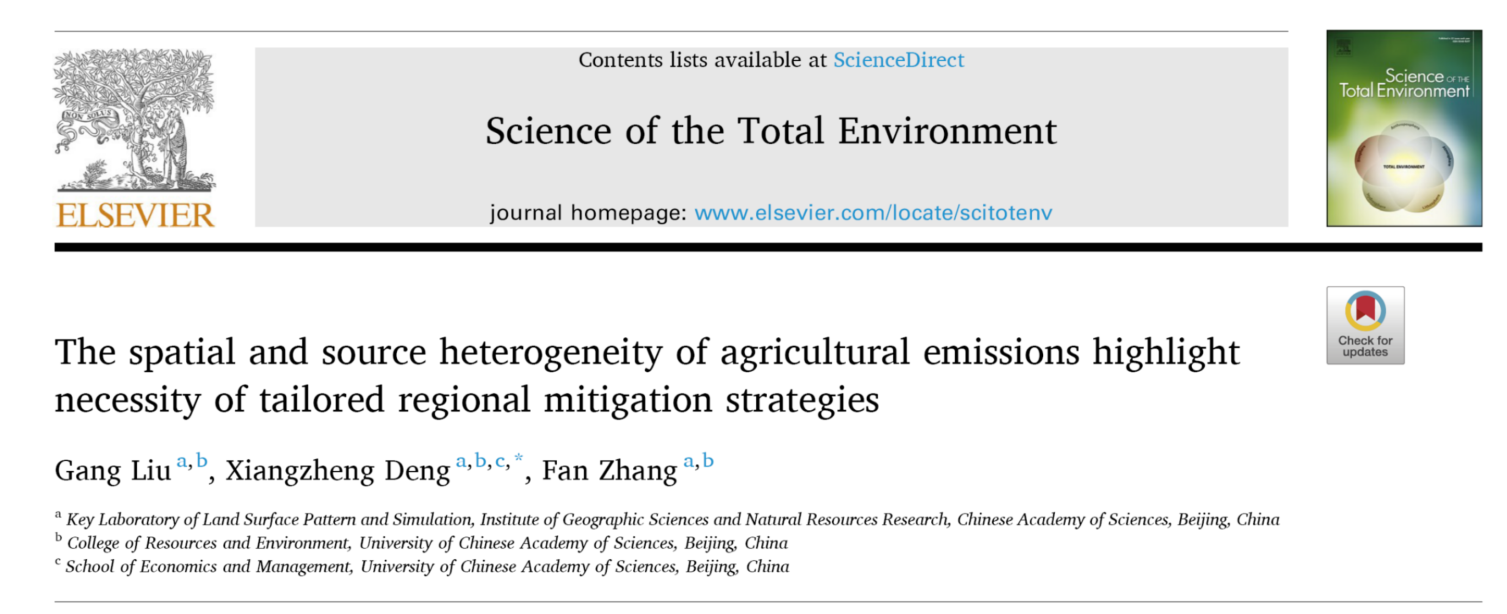
图文摘要 | Graphical Abstract
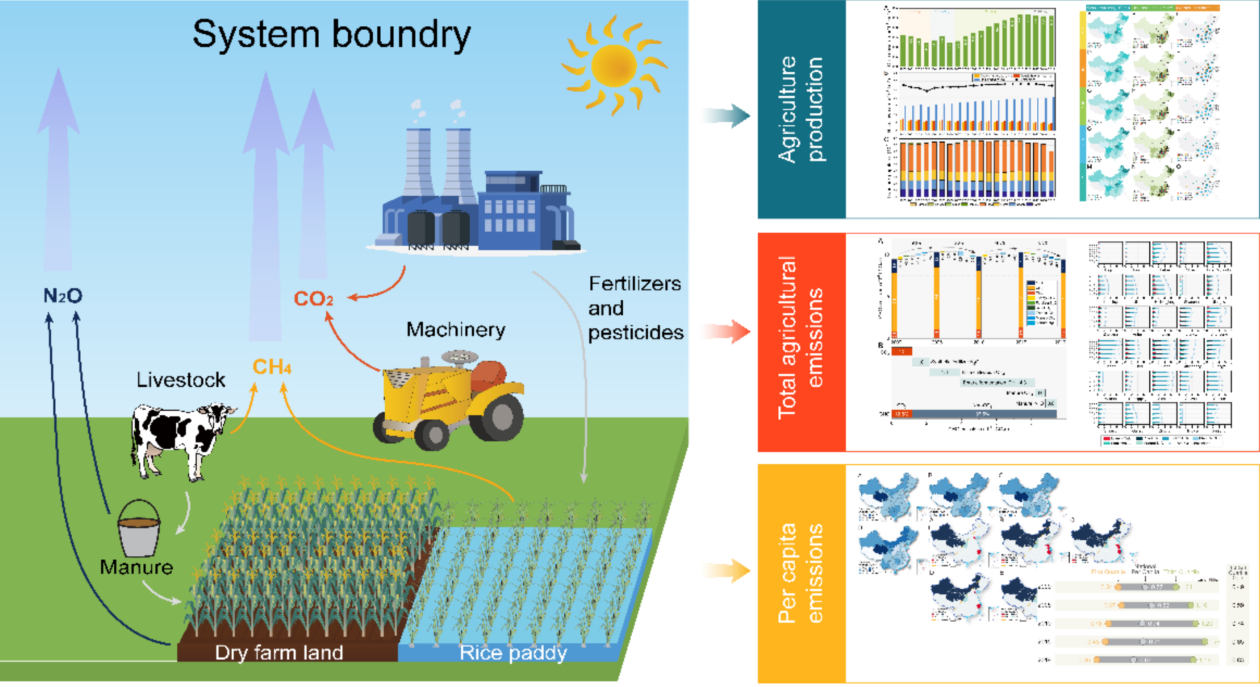
导读 | Introduction
农业在养活不断增长的世界人口的同时,也造成了大量的温室气体排放。采取积极行动限制和减少农业温室气体排放,实现农业可持续发展,对于应对全球气候变化至关重要。对农业温室气体排放进行准确评估是减缓的关键步骤,但目前仍缺少一项涵盖所有主要温室气体排放的全面研究对中国农业排放如何随时间、跨区域和分来源演变的特征进行系统性调查。本研究精心编制了 2000 年至 2019 年中国农业生产温室气体排放的时间序列数据集,涵盖了农业温室气体的主要来源、不同温室气体类型以及30个省域的各种生产活动。通过对不同地区、不同过程和不同气体的排放源进行剖析,揭示了农业排放随着时间推移产生变化的演变趋势和驱动因素。这项工作为确定优先减排区域、促进农业食物系统转型和实现净零排放目标奠定了基础。
Agriculture contributes considerable greenhouse gas emissions while feed the constantly expanding world population. Proactive actions to limit and reduce agricultural greenhouse gas emissions from the agri-food systems for achieving agricultural sustainability are crucial in combating global climate change. Accurate assessment of agricultural emissions is a critical step for mitigation. However, a comprehensive study covering all major emissions is still absent to systematically investigate how China's agricultural emissions have evolved over time, across regions, and by source. To fill this gap, we meticulously compiled a time-series dataset spanning 2000 to 2019, capturing emissions from agricultural production across China. Here we present the China's comprehensive time-series agricultural production emissions dataset from 2000 to 2019, which covers six primary sources of agricultural emissions, diverse gas types, and a wide array of production activities across 30 provinces. We investigated the evolution trends and dynamics driving the changes over time by dissecting significant sources of emissions across regions, processes and gases. Our results lay the foundation for prioritizing mitigating regions, catalyzing the transformation of the agri-food system, and realizing the ambitious net-zero target.
一、全国排放的历史趋势 | Historical trends in national emissions
中国农业温室气体排放量年际变化很大,其中2000 年至2005年全国农业温室气体排放增长了约9.5%,而从2015年至2019年则下降了约8.3%(图1A)。农业排放主要由非二氧化碳温室气体构成,二氧化碳仅占2019年农业温室气体排放总量的 12.5%(图1B)。畜牧业的排放量约占非二氧化碳温室气体排放量的三分之二以上。牲畜肠道发酵产生的甲烷排放是畜牧业的主要排放源,占畜牧业2019年非二氧化碳排放量的77.5%。
The interannual variability of greenhouse gas emissions from agricultural production in China is substantial, with national agricultural emissions increasing by about 9.5% from 2000 to 2005 and decreasing by about 8.3% from 2015 to 2019 (Fig. 1A). Agricultural emissions are predominantly comprised of non-CO2 gases, with CO2 accounting for only 12.5 % of total emissions in 2019 (Fig. 1B). Emissions from livestock activities constituting approximately 66.9%, or over two-thirds, of non-CO2 emissions. The pivotal source of emissions within the livestock sector is CH4 emissions resulting from the enteric fermentation of livestock, accounting for 77.5 % of non-CO2 emissions from the livestock sector in 2019.
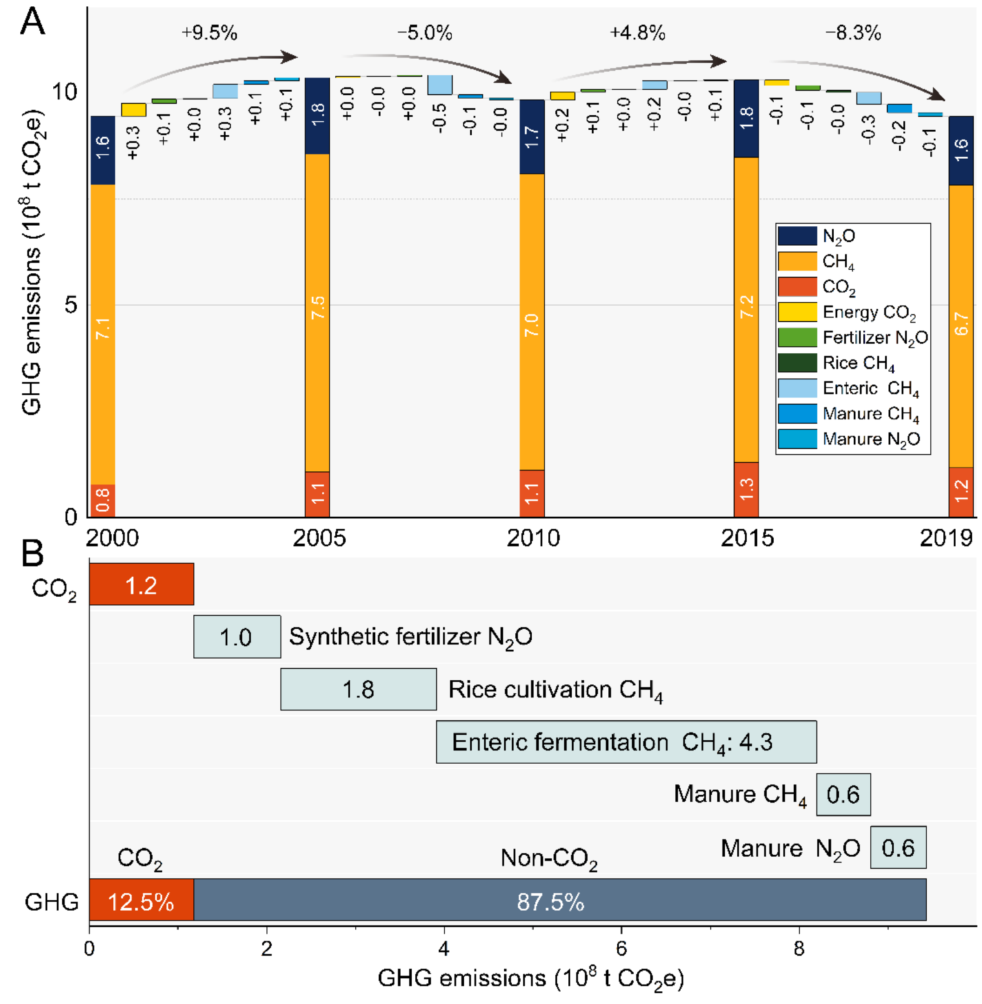
图1 中国农业温室气体排放的结构与变化
A:2000 年至 2019 年全国温室气体排放结构的演变,包括不同排放源贡献的变化
B: 2019年排放的构成,以及二氧化碳和非二氧化碳气体的占比
Fig. 1 The structure and variation of agricultural greenhouse gas emissions in China
A: The evolution of the national greenhouse gas emissions structure from 2000 to 2019, including the alterations in the contributions of these diverse sources. B: Detailed portrayal of emissions composition and the respective proportions of CO2 and non-CO2 gases in 2019.
二、农业排放的省域特征| Provincial characteristics of agricultural emissions
农业温室气体排放结构在各省之间存在显著差异,且各省排放随时间演变的趋势不同(图2)。内蒙古和黑龙江的农业排放在研究期间增长最为显著,分别增长约100%和67.8%。南方地区稻田甲烷排放占比较高,其中湖南、湖北和广东的2019年稻田甲烷排放量分别占总排放量的39.6%、38.8%和34.9%。
The composition of greenhouse gas emissions stemming from agriculture exhibits significant variation among provinces, and the evolution of emissions over time is characterized by divergence across provinces (Fig. 2). Agricultural emissions in Inner Mongolia and Heilongjiang increased most significantly over the study period, by about 100% and 67.8%, respectively. Rice paddy CH4 emissions constituted a substantial proportion of emissions in the southern provinces, notably Hunan, Hubei, and Guangdong, representing 39.6 %, 38.8 %, and 34.9 %, respectively, in 2019.
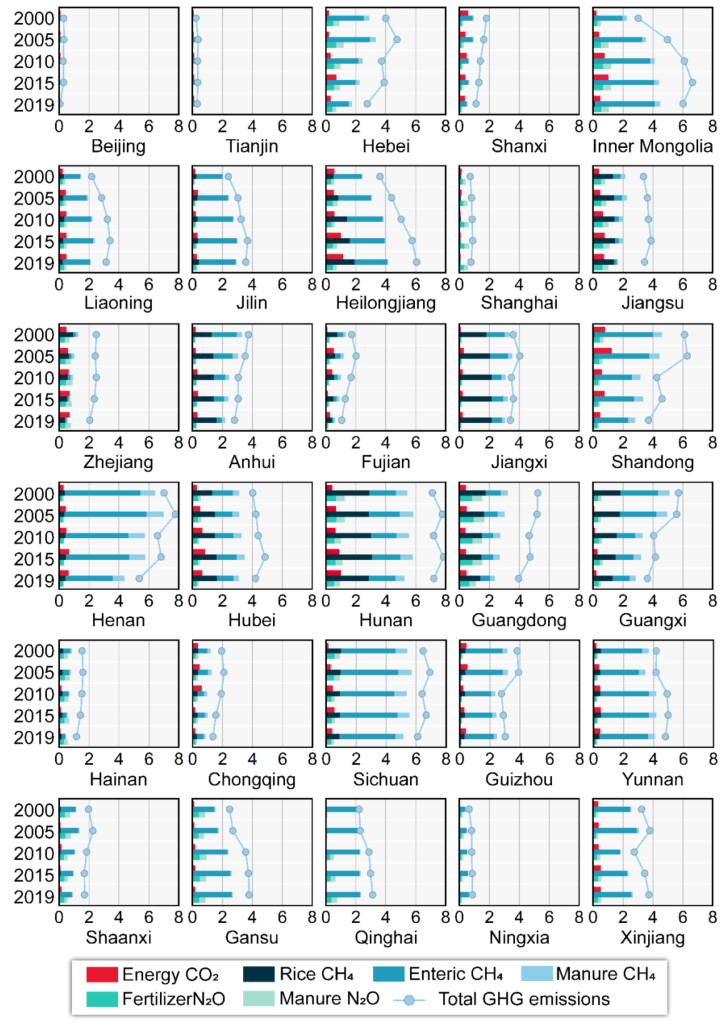
图2 2000 年至 2019 年期间各省农业温室气体排放量的结构和变化(单位:107吨二氧化碳当量)
Fig. 2 Provincial structure and variation of agricultural greenhouse gas emissions (107 tCO2e) for the period 2000 to 2019
三、农业排放演变的空间格局| Spatial patterns in the evolution of agricultural emissions
我们以方向分布和均值中心为分析工具,对各省不同来源温室气体排放的空间演化规律进行了分析(图3)。中国农业温室气体排放的排放重心在研究期间始终位于河南,呈现出向北移动的趋势。总排放的标准差椭圆方向角在研究期间扩大约3.7°,表明了各省之间农业温室气体排放总量的差距在不断扩大。
We conducted an analysis of the spatial evolution patterns of provincial GHG emissions from different sources using directional distribution and the mean center as analytical tools (Fig. 3). The mean center of China's total agricultural emissions has consistently been located in Henan, with a discernible northward shift from 2000 to 2019. The angle of directional distribution for total agricultural production emissions widened by approximately 3.7° over the study period, signifying an expanding disparity in emissions between provinces.
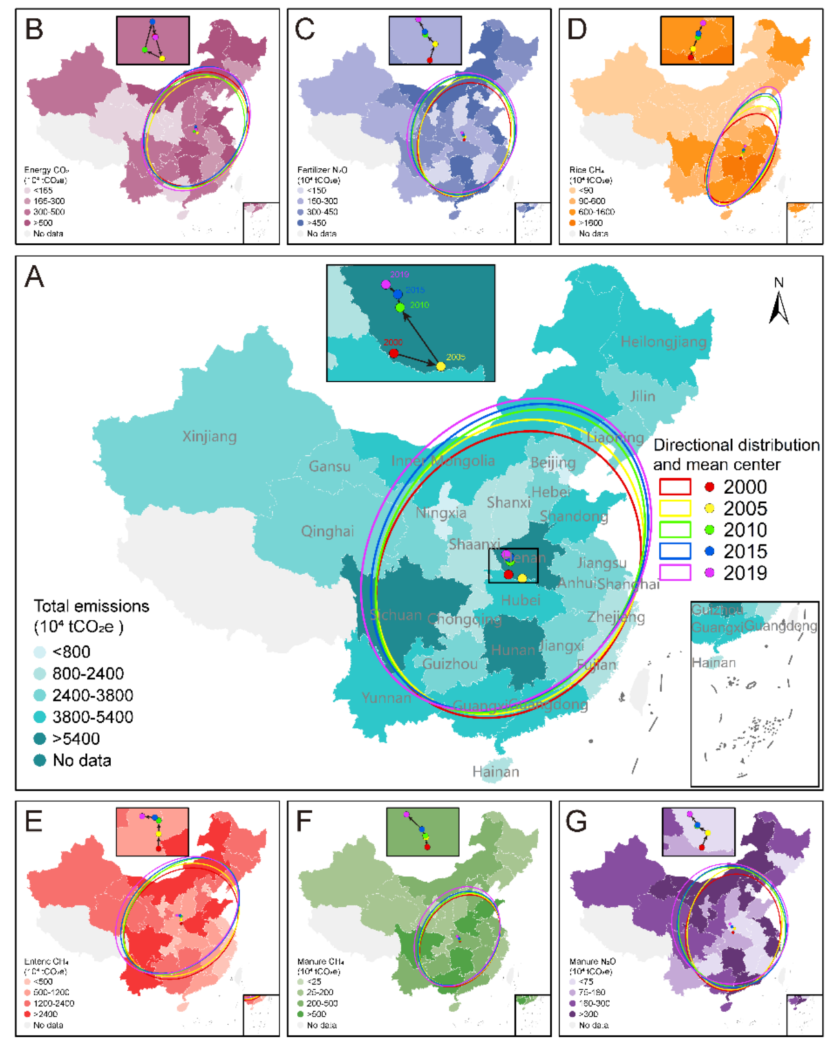
图3 2000 年至 2019 年农业温室气体排放总量(A)、能源相关二氧化碳排放(B)、化肥氧化亚氮排放(C)、稻田甲烷排放(D)、肠道发酵甲烷排放(E)、粪便甲烷排放(F)和粪便氧化亚氮(G)的标准差椭圆和重心
Fig. 3 The directional distribution and mean center of agricultural greenhouse gas emissions from 2000 to 2019 for total emissions (A), energy-related CO2 (B), synthetic fertilizer N2O (C), rice cultivation CH4 (D), enteric fermentation CH4 (E), manure CH4 (F), and manure N2O (G)
四、人均排放的时间演变 | Temporal evolution of per capita emissions
图4展示了人均温室气体排放量的时空变化趋势,这是了解各省差异的重要指标。从2000 年到2019年,中国人均农业温室气体排放量呈下降趋势,全国人均排放量下降了13.0%。尽管总体呈下降趋势,但从2000年到2005年,人均排放量出现了增长,增长了0.06吨二氧化碳当量。到2005年,中国人均农业生产排放量达到峰值(约为0.83吨二氧化碳当量)。
Fig. 4 shows the spatial-temporal trends of per capita GHG emissions, a crucial indicator for understanding the difference among provinces. Over the period from 2000 to 2019, China witnessed a declining trend in per capita GHG emissions, marking a 13.0 % decrease in the national per capita emissions. Despite this overall downward trend, there was an initial increase from 2000 to 2005, resulting in a growth of 0.06t CO2e per capita. By 2005, China's per capita agricultural production emissions had peaked at 0.83 t CO2 e, the highest value during the study period.
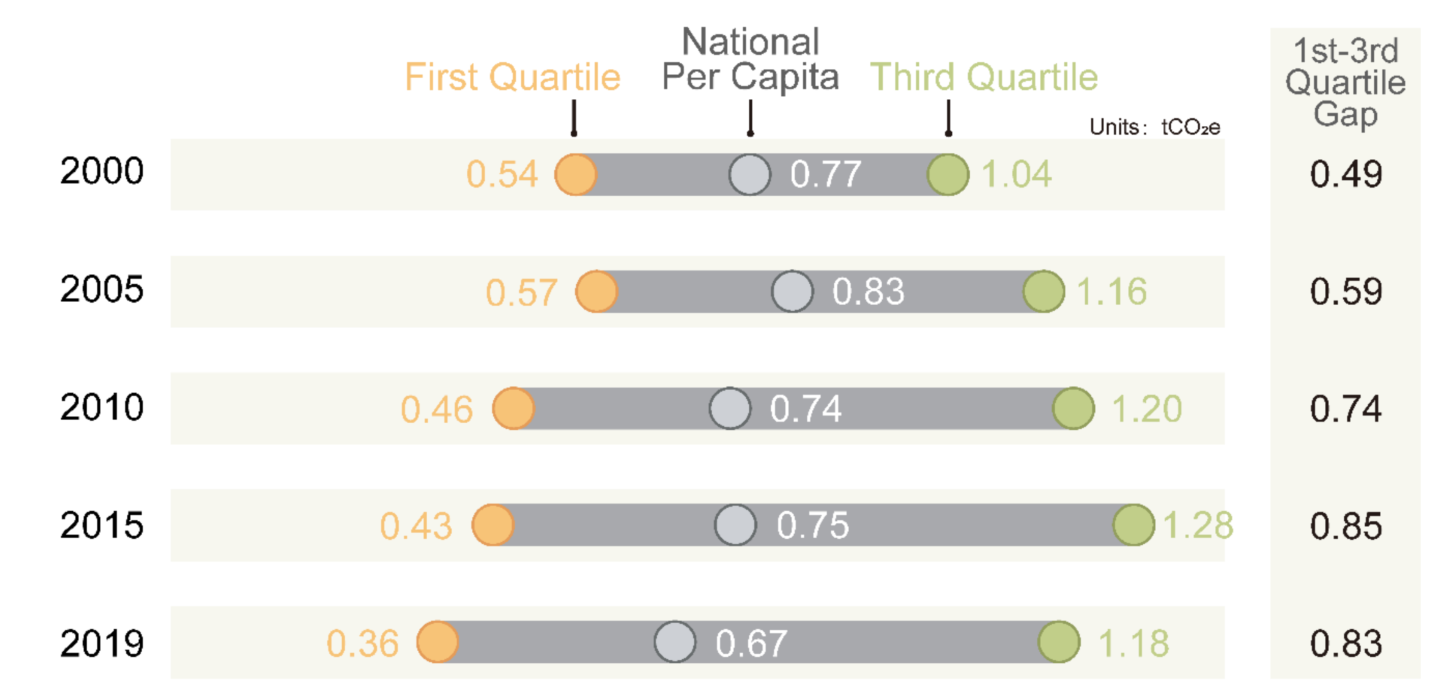
图4 2000 - 2019年全国和各省人均排放的时间演变
Fig. 4 The temporal dynamics of both national and provincial per capita emissions from 2000 to 2019
五、人均排放的空间特征| Spatial characteristics of per capita emissions
中国各省农业人均排放量存在明显的空间自相关性,随着时间的推移,空间自相关性逐渐增强。如图 5 所示,各省人均农业排放量呈现出明显的西高东低的空间格局。新疆、青海、甘肃、宁夏和内蒙古出现了“高-高”集群,而北京、天津、浙江、江苏和山东则出现了“低-低”集群。有趣的是,以“胡焕庸线”为界,所有呈现“高-高”集群的省域都位于中国的西部,而“低-低”集群的省份都位于经济较发达的东部地区。
There is an obvious spatial autocorrelation of per capita agricultural emissions in all provinces of China, which gradually increases over time. As shown in Fig. 5, per capita agricultural emissions in the provinces exhibit a distinct west-east blocked spatial pattern. High-High clusters were identified in Xinjiang, Qinghai, Gansu, Ningxia, and Inner Mongolia, while Low-Low clusters manifested in Beijing, Tianjin, Zhejiang, Jiangsu, and Shandong. Interestingly, using the Hu Line as a boundary, all provinces with "high-high" clusters are located in the west of China, while provinces with "low-low" clusters are located in the more economically developed eastern regions.
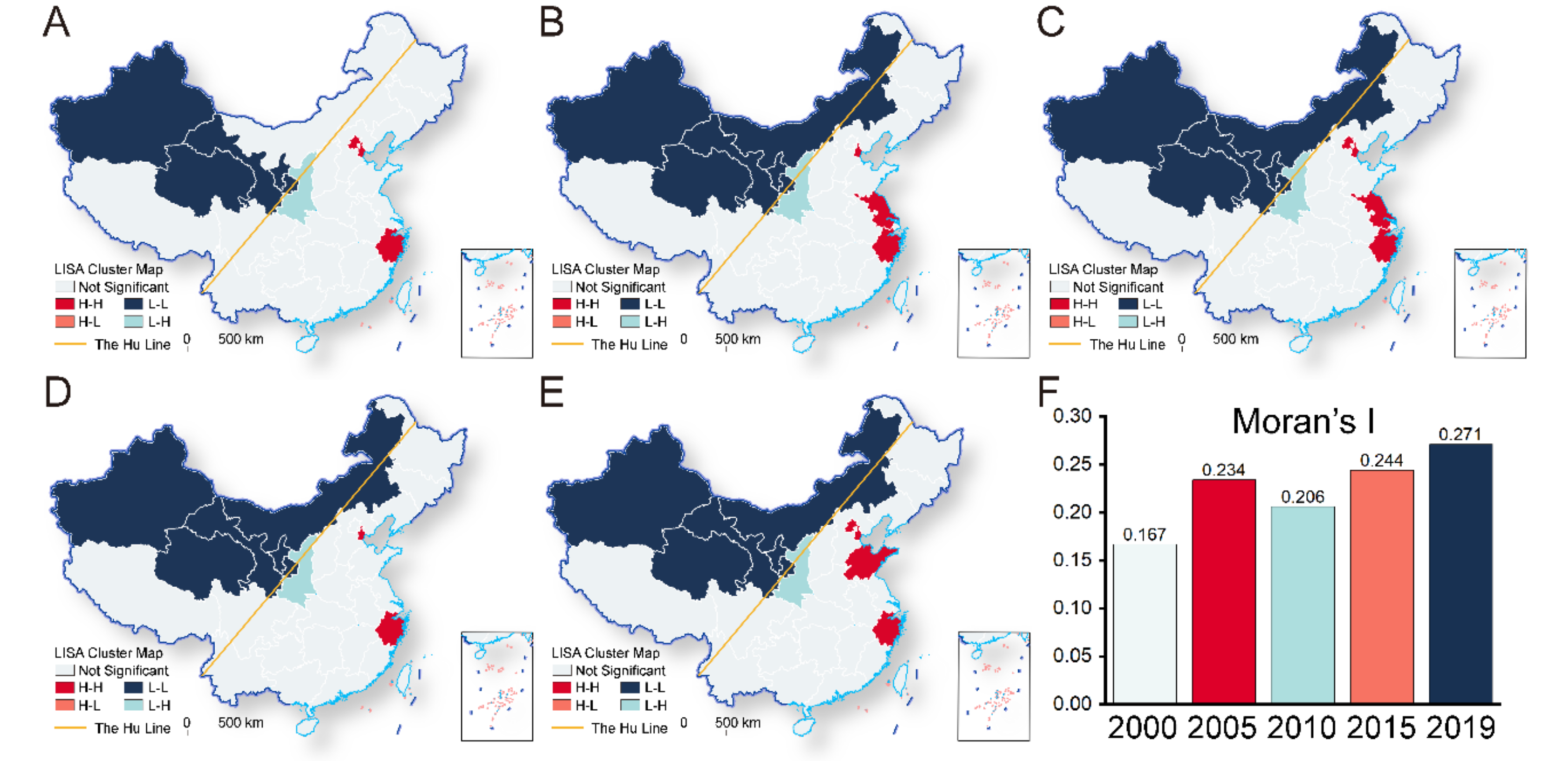
图5省域人均排放的空间聚类。
(A)-(E) 2000 年至 2019 年人均排放集群图;(F) 莫兰指数。
Fig. 4 The spatial clustering of provincial per capita emissions.
(A)-(E) per capita emissions cluster maps from 2000 to 2019; (F) The Moran's Index.
总结 | Conclusions
本研究采用全面的框架实现了中国次国家级农业温室气体排放的全面评估,提供了详细的数据,对于推进农业食物系统气候影响相关研究、塑造未来研究和政策制定的轨迹至关重要。在为各省制定减缓战略和目标时,必须考虑区域农业排放的差异。此外,还需认识到减少农业食物系统温室气体排放的努力与追求粮食安全目标之间的密切联系。
This study conducted an assessment of emissions from agricultural production at the provincial level within China using an exhaustive framework, offering crucial data to propel research on the climate implications of agricultural food systems and steer future policymaking. It is imperative to consider disparities in regional agricultural emissions when devising mitigation strategies and objectives for each province. It is essential to recognize that efforts to mitigate agri-food system GHG emissions are intricately intertwined with the pursuit of food security.
本文内容来自ELSEVIER旗舰期刊Sci Total Environ第914卷发表的论文:
Liu, G., Deng, X., Zhang, F., 2024. The spatial and source heterogeneity of agricultural emissions highlight necessity of tailored regional mitigation strategies. Science of The Total Environment 914, 169917.
DOI: https://doi.org/10.1016/j.scitotenv.2024.169917
本文经由STOTEN全环境科学公众号推送,原文链接:STOTEN | 中国科学院地理科学与资源研究所邓祥征研究员团队:农业排放的异质性凸显了实施针对性减缓策略的必要性 (qq.com)


